Analysis
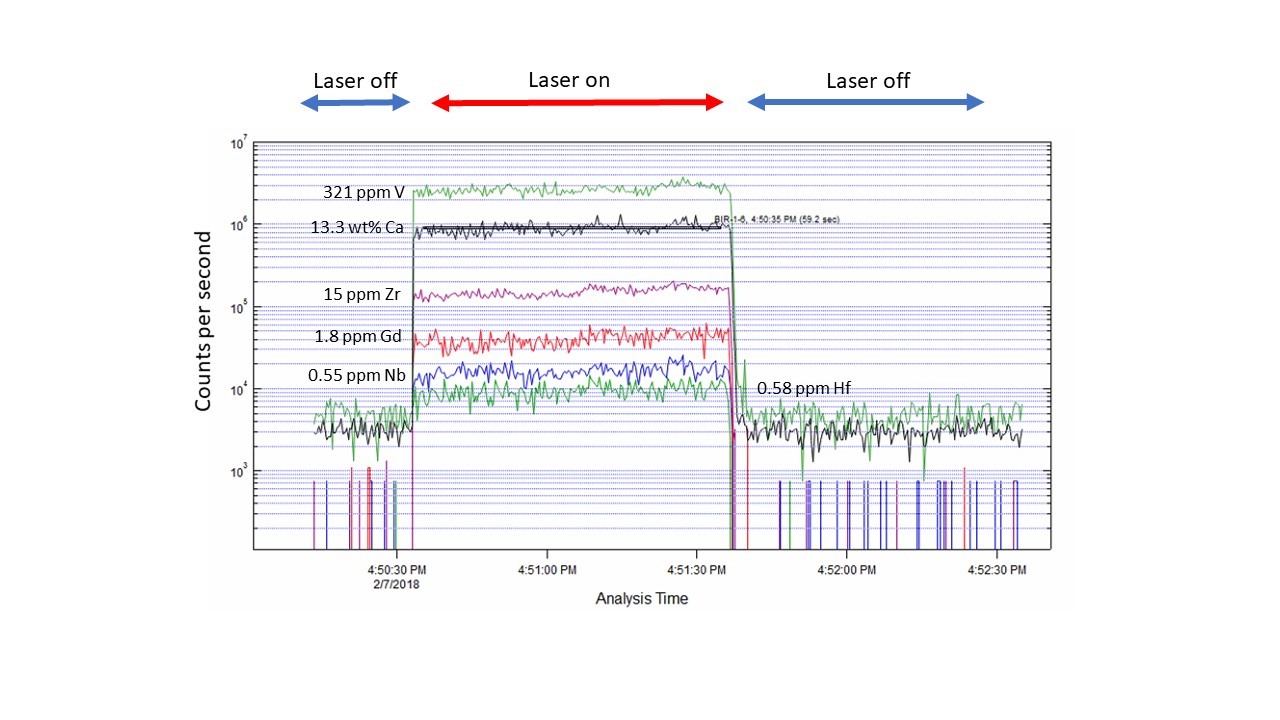
The LA-ICPMS method provides time-resolved analytical data (seen in the figure below), meaning that the quadrupole “hops” to an analyte mass, counts on that mass for a specific dwell-time, then repeats the process, all as the laser is drilling a hole in the sample.�� The ablation rate is on the order of microns/second, and depends on the nature of the material, as well as the laser fluence, hole diameter and laser rep rate.�� Hence, the time-resolved data comprise a depth profile into the sample, and therefore information on sample homogeneity.��

Example of a time-resolved spectra for a natural basalt glass from Iceland (USGS SRM BIR-1) for several trace element analytes, with the concentrations indicated.�� A typical analysis involves 20 seconds of background collection with the laser off (He carrier gas flowing from the cell into the mass spectrometer) then 60 seconds of sample ablation (in this case, a 50 micron diameter spot, 10 Hz repetition rate), followed by 60 seconds of cell washout with the laser off.�� A low abundance isotope of Ca (43Ca, 0.135%) is measured for standardization.
Conversion of the time-resolved data into a quantitative analysis requires information on the concentration of an internal reference element that has been measured independently, as well as the concentration of the analyte present in a standard having a generally similar matrix composition.�� The internal reference element is used to correct for the difference in ablation yield between the unknown and the external standard.�� For many geological materials, Ca, Si or Fe can be used as internal reference elements, and is measured by electron microprobe.��The LA-ICPMS laboratory has a library of materials for which the concentrations of a variety of trace elements are known, and some are certified reference materials (e.g., NIST 610 and 612 glasses, see the Table).�� If there is a particular material and suite of elements not listed below, please contact the lab, as we have the capability of materials synthesis in the .
Table Summary of materials in the DalLAIS standards library
Standard name |
matrix |
elements |
reference |
NIST 610 |
Silicate glass |
Alkalis, alkaline earths, transition metals, REE; ~400 ppm level |
Refer to the GEORem website: http://georem.mpch-mainz.gwdg.de/ |
NIST 612 |
Silicate glass |
As above; ~40 ppm level |
As above |
JBsulfide |
Ni-sulfide |
PGEs, Re |
Mungall and Brenan (2014) |
NiS4 |
Ni-sulfide |
�� |
Brenan (2015) |
MSS5 |
MSS (Fe-sulfide) |
PGEs, Re, Au, |
Dare et al (2010) |
Ge4 |
Ge-Sb-S glass |
PGEs, chalcogens, Au, Ag |
Liu et al (2017) |
BHVO1 |
Hawaiian basalt; powder fused at 1400 C and 1 GPa |
Alkalis, alkaline earths, transition metals, REE; natural levels |
Refer to the GEORem website: http://georem.mpch-mainz.gwdg.de/ |
BIR1 |
Iceland basalt; fused at 1400 C and 1 GPa |
Alkalis, alkaline earths, transition metals, REE; natural levels |
Refer to the GEORem website: http://georem.mpch-mainz.gwdg.de/ |
References for the DalLAIS standard library: Brenan, J.M. (2015) Se-Te fractionation by sulfide–silicate melt partitioning: Implications for the composition of mantle-derived magmas and their melting residues.�� Earth and Planetary Science Letters, 422, 45-57. Dare S.A.S., Barnes S.J. and Prichard H.M. (2010) The distribution of platinum group elements (PGE) and other chalcophile elements among sulfides from the Creighton Ni-Cu-PGE sulfide deposit, Sudbury, Canada, and the origin of palladium in pentlandite. Miner Deposita DOI 10.1007/s00126-010-0295-6. Liu, Y, Brenan, J.M. and Bray, C.J. (2017) Synthesis of a chalcogenide glass standard for laser-ablation inductively coupled mass spectrometry (LA-ICPMS).�� Economic Geology, 112, 2005-2021. Mungall, J. E, and Brenan, J.M.�� (2014) Partitioning of platinum-group elements and Au between sulfide liquid and basalt and the origins of mantle-crust fractionation of the chalcophile elements. Geochimica et Cosmochimica Acta, 125 pp 265-289.�� �� |
|||
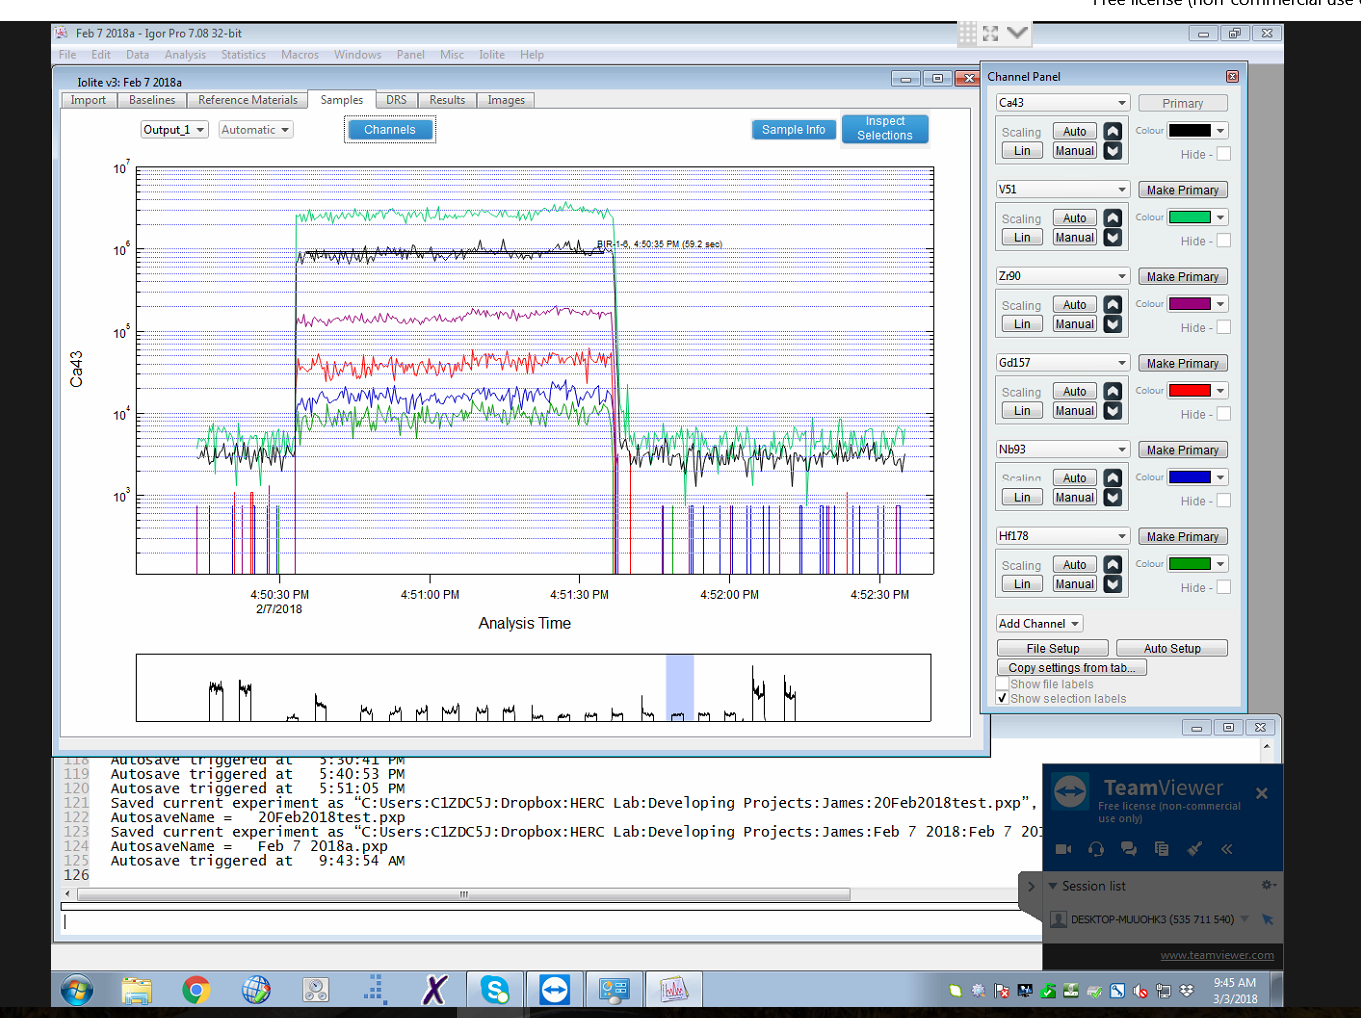
The laboratory uses the most recent version of the for data reduction.�� The software provides a user-friendly graphical interface, shown here.

Data reduction involves a simple workflow of automated background correction, selection of integration intervals for the reference materials and unknowns, then calculation of concentrations, analytical precision, and limits of detection.�� The software takes into account instrument drift in the background and reference signals.��
In addition to the measurement of trace element concentration in a single spot, it is also possible to integrate multiple, closely spaced analyses into a contoured trace element map, revealing the details on the spatial distribution of trace elements in a sample.�� An example of maps of the distribution of barium (a) and gallium (b) in biotite from the South Mountain batholith (NS, Canada) is shown here:
 The maps can also be interrogated on a pixel by pixel basis to derive quantitative information on the concentration gradients represented by the colour contrast. Shown here is the variation in barium and gallium across the rectangular region of interest outlined in the above images:

